Aurora & Space Weather
Tracker
Real-time Aurora Forecasts, Solar Flares, CME Tracking & Geomagnetic Storm Alerts.
Can I See the Northern Lights Tonight?
Search any city or town worldwide (e.g. Mahnomen, Cape Town, Spur)
Full aurora visibility guide & FAQ →📡 Local Infrastructure Disruptions HUD
Waiting for live telemetry…
To see the northern lights tonight, five factors need to line up: a high enough Kp index, clear skies (low cloud cover), minimal moon brightness, real nighttime darkness, and a low enough magnetic latitude for your location. Even a strong geomagnetic storm stays invisible if it's cloudy or not fully dark yet where you are.
The 5 factors that decide it
- Geomagnetic activity (Kp index) — measures storm strength, 0 to 9.
- Cloud cover — you need a clear line of sight to the sky.
- Moon brightness — a dim or absent moon gives better contrast.
- True darkness — displays are usually most visible in the hours around local midnight.
- Magnetic latitude — sets the minimum Kp your location actually needs.
Roughly how much Kp your location needs
Based on NOAA's own published relationship (the aurora oval's edge sits near 66° magnetic latitude at Kp 0, moving about 2° closer to the equator per Kp level). Magnetic latitude — not map latitude — is what matters; figures below are approximate.
| City | Approx. magnetic latitude | Kp needed |
|---|---|---|
| Tromsø, Norway | ~67° MLAT | Kp 0+ |
| Fairbanks, USA | ~65° MLAT | Kp 1+ |
| Edinburgh, UK | ~58° MLAT | Kp 3+ |
| London, UK | ~53° MLAT | Kp 5+ |
| New York, USA | ~52° MLAT | Kp 5+ |
⚡ Live X-Ray Flux & Flare Alerts
AIA 131Å solar flare footage — NASA SDO, Dec. 4 2014 M6 flare
NASA/SVS☀️ Multi-Wavelength Solar Imagery
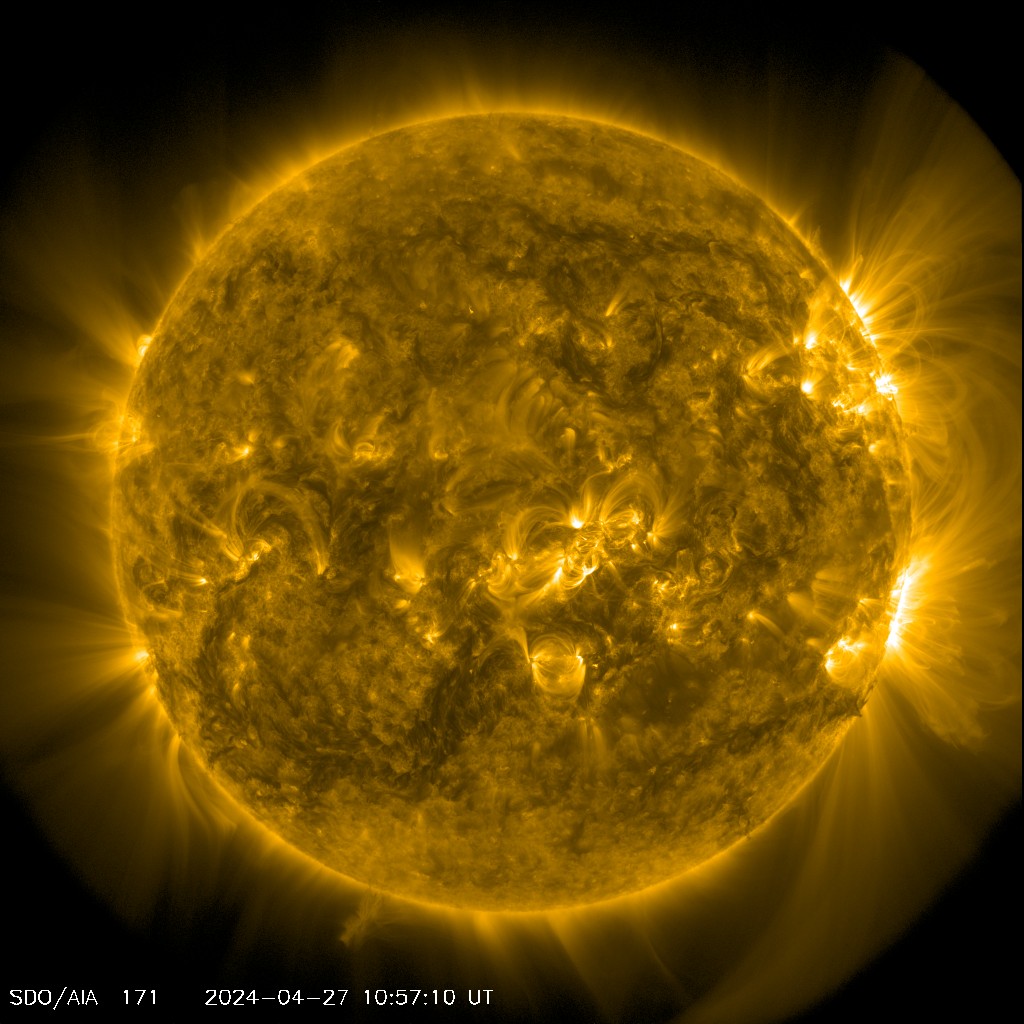
AIA 0171 • Magnetic Loops
Source: NASA SDO / Live Update
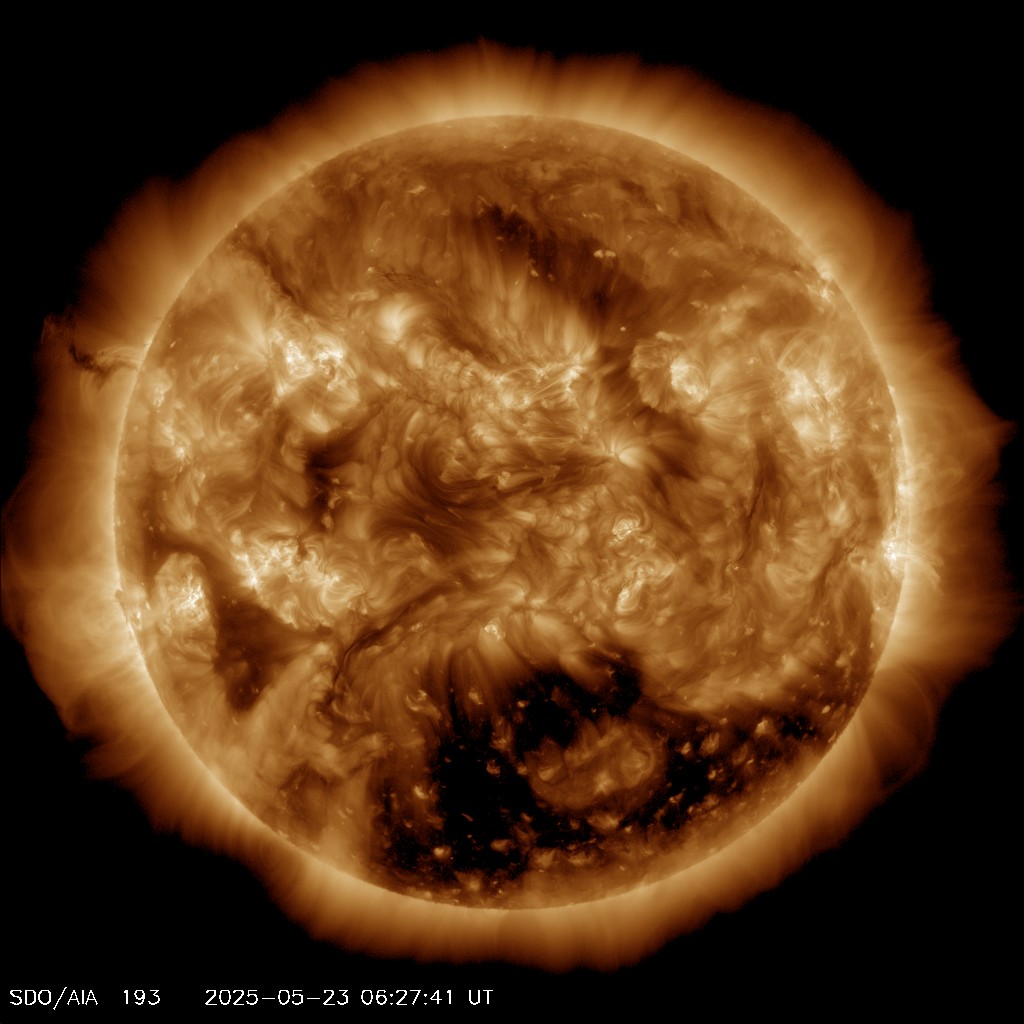
AIA 0193 • Coronal Holes
Source: NASA SDO / Live Update
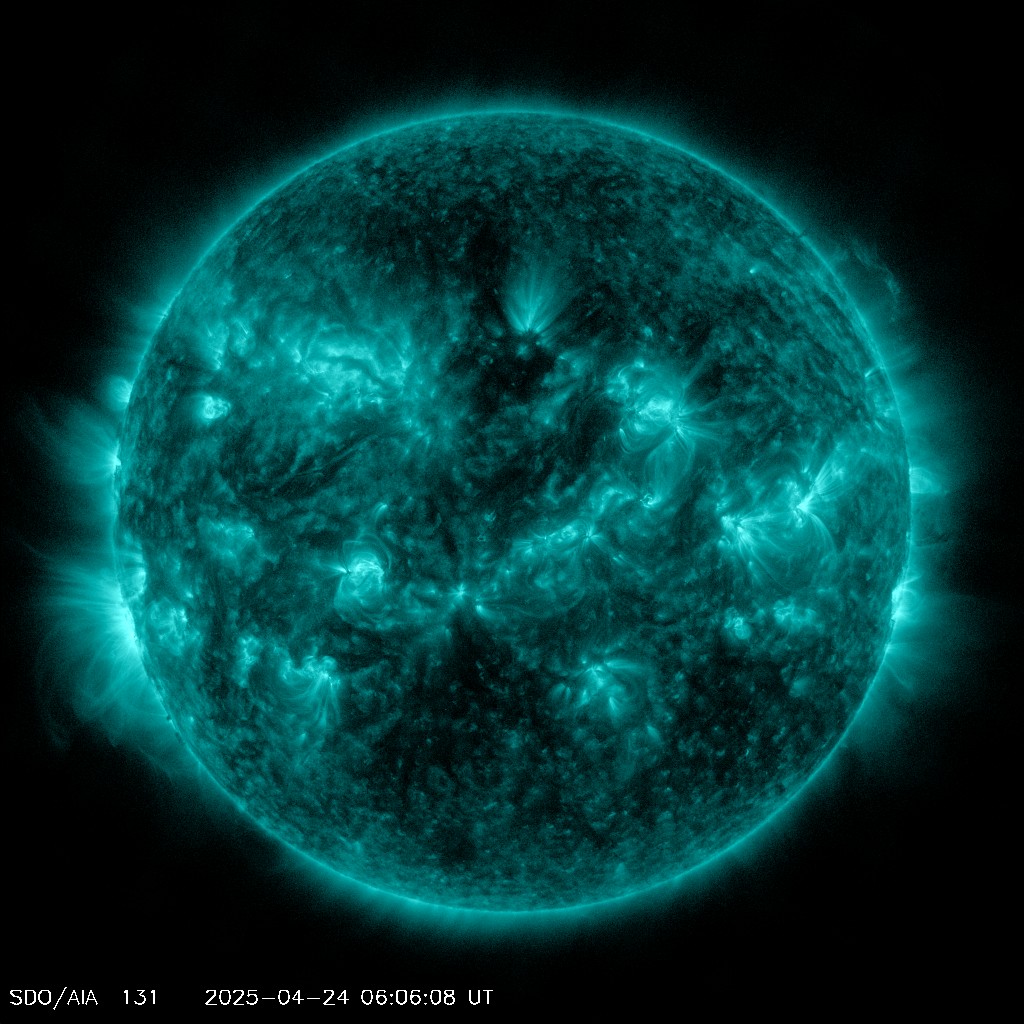
AIA 0131 • Solar Flares
Source: NASA SDO / Live Update
📰 Space News Today
AI Space Weather Summary
Current Space Weather
Live Dashboard
Solar Wind Speed
Speeds over 500 km/s indicate a fast-moving storm capable of sparking bright colors.
Telemetry: DSCOVR Spacecraft / ACE
IMF Bz
Negative values mean Earth's magnetic shield is open to let the solar storm in.
Telemetry: DSCOVR Spacecraft / ACE
Proton Density
In plain English: how 'thick' the stream of solar particles is. Denser + faster wind = a stronger punch to Earth's magnetic field.
Telemetry: DSCOVR Spacecraft / ACE
Mean visibility probability, northern hemisphere (≥ 45° N)
🔍 Forecast Analytics & Empirical Reasoning
Solar flares can disrupt GPS accuracy, satellite links, and HF radio. X-class events cause the biggest blackouts; M-class may briefly degrade navigation.
Largest X-ray class · last 24 h
Illustrative 3D globe · for live NOAA aurora data see the link below
Live aurora data →Tracking every layer of space weather
Tonight's Planet Visibility Report
Use the search terminal above, or pin a location on any to see a live Jupiter, Mars, and Saturn visibility report here.
Aurora & Stargazing Alert Station
Pin a location first to enable alerts.
Alerts fire while this tab is open — this isn't a background push notification that arrives with your browser closed, which would need separate server infrastructure.
Real-Time Solar Wind & Activity
Live measurements from NOAA's L1 monitoring spacecraft, upstream of Earth.
Solar Wind Speed
Density
IMF Bt
IMF Bz
Calculating real-time impact window based on L1 spacecraft data streams…
Live Solar Imagery
Solar flares — flaring regions of the corona
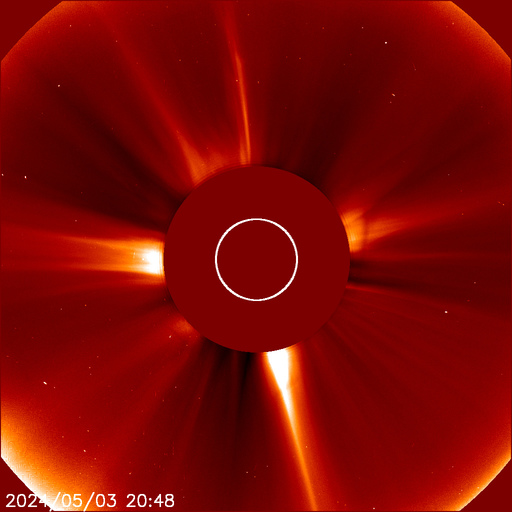
Coronal mass ejections — inner solar corona
Imagery courtesy of NASA/SDO and ESA/NASA SOHO. Click either image to view the official source page.
Live Webcams
Watch for the aurora right now
Solar Cycle 25 Monitor
Solar Cycle 25 reached its peak in October 2024 and has been in its declining phase since — 22 months and counting. Strong individual flares can still occur during a decline, as happened in prior cycles years after their own peaks.
~60% through the full 11-year cycle
Last 7 Days — Peak Flare Class
Real NOAA data, genuinely 7 days (not 30 — that history isn't available from this app's current data sources).
📡 Syncing active NOAA solar disk telemetry…
Aurora Sighting Reports
Live Sighting Feed
Real reports from aurora watchers, tagged with the current global Kp index for context.
Region tags group sightings for browsing only. Kp is the single global planetary index — this app doesn't yet have distinct per-region magnetometer station data, so the same real, live Kp value is shown for every sighting regardless of region.
Aurora Intensity Report
This session only — not shared with other visitors
Space News Today
Understanding Space Weather
What is space weather?
Space weather refers to the constantly changing conditions in near-Earth space, driven by activity on the Sun. The Sun continuously releases a stream of charged particles called the solar wind, and occasionally erupts with solar flares and coronal mass ejections (CMEs) — sudden, massive bursts of radiation and plasma. When these reach Earth, they interact with our planet's magnetic field, sometimes triggering geomagnetic storms. The same activity that can disrupt technology also produces the aurora, one of the most visually striking natural phenomena on Earth.
Why it's worth tracking
Space weather isn't just a scientific curiosity — it has measurable, real-world effects. Strong geomagnetic storms can induce electrical currents in power grids and pipelines, disrupt high-frequency radio communication used by aviation and maritime industries, introduce errors into GPS positioning, and increase atmospheric drag on satellites in low Earth orbit. On the other hand, the same conditions that create these risks also produce the aurora borealis and aurora australis, giving skywatchers a reason to check conditions before heading out on a clear night. Understanding current and forecast conditions helps both industries that depend on reliable technology and hobbyists hoping to catch a display.
Where this data comes from
Every live figure on this site — Kp index, solar wind speed, IMF Bz/Bt, X-ray flux, proton flux, and more — is sourced directly from NOAA's Space Weather Prediction Center (SWPC), the official U.S. government agency responsible for space weather forecasting, along with real-time measurements from NASA and NOAA spacecraft positioned at the L1 Lagrange point, roughly 1.5 million km from Earth toward the Sun. Cloud cover and weather data come from the Open-Meteo API. We don't estimate or fabricate any of the live numbers shown across this site — every metric links back to its real source, and every dedicated metric page explains what it measures, why it matters, and how scientists actually collect it. See our Learn section for plain-English explanations of every concept covered here, or the historical archive for real past storms including the Carrington Event, the 2003 Halloween Storms, and the May 2024 Gannon Storm.
How to use this site
Start with the live Kp index and aurora status at the top of this page for a quick read on current conditions. Use the location search to get a forecast tuned to your exact latitude, since aurora visibility depends heavily on magnetic latitude, not just how far north you are on a map. Check the solar flare and CME trackers for a sense of whether more activity might be headed toward Earth in the coming days, and browse the live webcams above if you'd rather watch than wait outside.
A living, evolving tracker
This site is actively maintained and expanded — from planet visibility tools built on real orbital mechanics, to a citizen-science sightings map where aurora watchers around the world can report what they're seeing in real time, to a growing historical archive reaching back decades. Space weather itself never stops changing, and neither does this tracker.